

Sealminer A4 Ultra Hydro
Bitcoin & Bitcoin Cash ASIC Miner
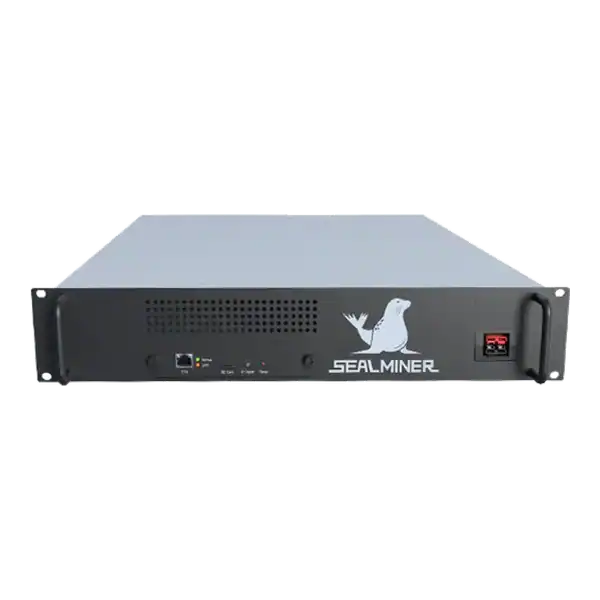

886TH
HASHRATE
9.45W/TH
EFFICIENCY
8373W
POWER
£932.21
EST. MONTHLY
NO PAYBACK
EST. ROI
Build ASIC profit forecast ranges using base, downside and severe cases for accepted hashrate, energy, uptime, difficulty, reward, fees, price and repairs.

ASIC profit forecast ranges depends on a clear operating boundary and evidence that can be checked before money or equipment is committed. An ASIC profit forecast is a conditional planning model, not a promise of future earnings. Hardware output, uptime and energy may be measured.
At the same time, price, difficulty, transaction fees, pool payrate, repairs and residual value require assumptions. A useful forecast separates observed inputs from scenarios, shows which variables drive the result and records a version and review date.
This article focuses on forecast construction and communication, keeping it distinct from the calculator input audit and the site's historical profitability lessons.
ASIC profit forecast ranges: A credible forecast helps a business decide under uncertainty and remains auditable after reality differs. Build ranges, show the boundary and preserve the version.
A miner is checking ASIC profit forecast ranges. Choose a scenario narrative before the numbers, such as tariff increase, faster network growth, reduced uptime or major repair.
Define the decision, entity, hardware, operating mode, site, currency and forecast horizon before entering numbers.
Separate gross receipts, variable contribution, operating profit, cash flow, tax and capital return. Each supports a different decision.
Choose a scenario narrative before the numbers, such as tariff increase, faster network growth, reduced uptime or major repair.
Write the intended outcome before looking at a headline hashrate. A learning device, a useful room heater, a quiet home miner and a commercially productive machine are different purchases. The correct comparison changes when the available circuit, sound limit, heat demand, pool route or expected ownership period changes.
Use a dated decision sheet and keep manufacturer claims separate from measured results. Record the exact model, variant, power supply, firmware and operating mode. Similar product names do not make accessories, voltage, firmware or thermal limits interchangeable.

Use accepted work and complete measured power where available. Document pool method, firmware fee and tariff contract.
Use dated network and price observations as the starting point, then apply explicit paths or ranges. Do not imply that historical averages are expected outcomes.
Record hardware condition, warranty, repair and resale evidence. New and used machines should not share one failure assumption without support.
Prefer the manufacturer specification, manual and firmware portal for identity and limits. But treat them as the starting point rather than a promise of site performance. Keep a copy of the pages and files used because support pages, downloads and product revisions can change.
Ask the seller for a serial photograph, condition statement, included accessories and a recent operating record for the actual unit. A generic product image cannot prove board revision, power supply condition, repair history or whether the miner reaches stable accepted work.
Version formulas, inputs and sources. Require approval for changes used in customer, lender or investment communication.
Use fair, clear language and place risks beside results. A disclaimer at the bottom does not correct an exaggerated headline.
Set triggers for reforecasting after tariff, firmware, network, pool, site or hardware changes.
A competent person should confirm the electrical route for the real continuous load. Check voltage, protective device, earthing, cable, connector, socket, isolation and ventilation together. Do not assume that a plug physically fitting a socket proves that the circuit is suitable for sustained operation.
Place the miner on a trusted network segment with no unnecessary inbound exposure. Change supplied credentials, use a documented wallet and pool account, set approved backup endpoints and confirm that every endpoint belongs to the intended operator before power is applied.
Run sensitivity and identify the variables that explain most variation. Avoid false precision beyond the evidence.
Add correlation: lower asset price can weaken resale while a heat event reduces uptime and raises cooling cost.
Compare forecast with actual monthly results and attribute variance to input, model or execution. Use the record to improve the next version.
Measure power at the wall and compare local hashrate with accepted pool work over a representative period. Local display figures can look healthy while stale shares, invalid work, reconnects or a wrong payout address reduce useful output.
Calculate revenue and cost over a range, not one favourable day. Include electricity, pool fees, auxiliary cooling, maintenance, downtime, conversion costs and hardware value. For a heat-use case, credit only heat that replaces a cost the owner would otherwise incur.
| Risk | Evidence to get | Control |
|---|---|---|
| One favourable case shown | Approved scenario set | Publish range |
| Observed data mixed with forecast | Input classification | Label clearly |
| False precision | Uncertainty and source quality | Round appropriately |
| Downside variables independent | Correlated scenario | Stress jointly |
| Model never reconciled | Forecast versus actual review | Calibrate |
Rank each risk by consequence and by the practical ability to detect it before purchase. A low-priced machine with uncertain firmware, exhausted cooling or a weak algorithm market can require more working capital and attention than a newer unit with a higher invoice price.
Set written stop conditions. Examples include an unsafe supply, unavailable official firmware, rejected work above the approved limit, repeated thermal shutdown, no lawful payout route or an energy break-even price below the contracted rate. A stop condition prevents sunk cost from becoming the reason to continue.
Build three cases for one serial and write the operational story behind each. Have another reviewer reproduce the outputs from source evidence.
After one reporting period, compare actual with all three cases, explain variance and decide whether assumptions or controls need revision.
Begin with one unit or the smallest sensible batch. Photograph labels and connections, export the original configuration, note ambient conditions and record the start time. Watch the kernel or system log, board detection, fan behaviour, temperatures, local hashrate, pool connection and accepted work.
Do not declare acceptance from a short dashboard snapshot. Run long enough to expose heat soak, intermittent network faults and pool variance. Retain the test record with the invoice, serial number, firmware file and any seller correspondence so a later repair or warranty question has a clear baseline.
The checklist is deliberately evidence based. Marketing language such as home friendly, efficient or profitable has no fixed meaning without a measured operating mode and a real site boundary. The record should make it possible for another competent person to reproduce the decision.
ASIC profit forecast ranges: A credible forecast helps a business decide under uncertainty and remains auditable after reality differs.
Define the decision, entity, hardware, operating mode, site, currency and forecast horizon before entering numbers.
Use accepted work and complete measured power where available. Document pool method, firmware fee and tariff contract.
Version formulas, inputs and sources. Require approval for changes used in customer, lender or investment communication.
A credible forecast helps a business decide under uncertainty and remains auditable after reality differs. Build ranges, show the boundary and preserve the version. The quality of the decision matters more than producing an attractive annual number.
Use The Mining Shop UK tools and support pages to compare the exact hardware against your real electricity, installation, pool and operating constraints before ordering or commissioning it.
Label every input as measured, current observed, contractual or forecast. Publish base, downside and severe ranges with the same cost boundary and time horizon.


Build a five-year ASIC replacement calendar from efficiency gap, tariff, failure rate, parts, firmware, resale, network scenarios and capital gates.

Compare European ASIC mining energy costs using the correct tariff band, taxes, grid connection, curtailment, cooling, contracts and location risks.

Run a UK mining tariff cashflow stress test across unit rate, standing and capacity charges, VAT cash flow, reward, difficulty, downtime and fixed commitments.
Join the ASIC Mining Discussion
Members can read and join the discussion
Log in to read comments from other miners. Create a free account if you would like to ask a question or share your experience.
Membership helps us protect the discussion from spam and keep answers useful.