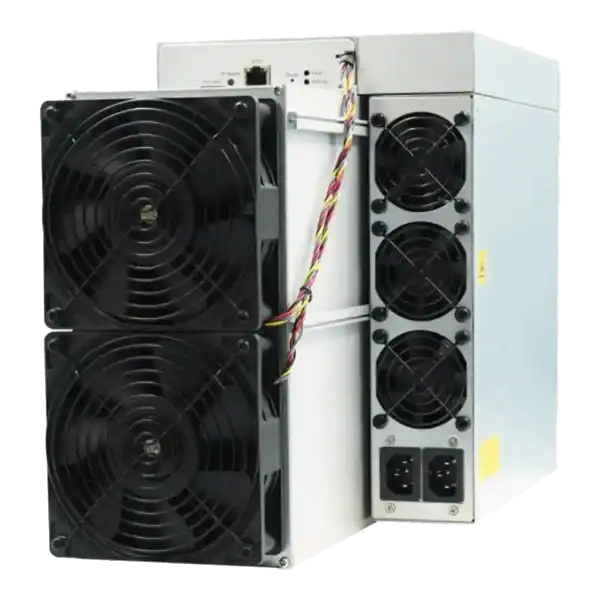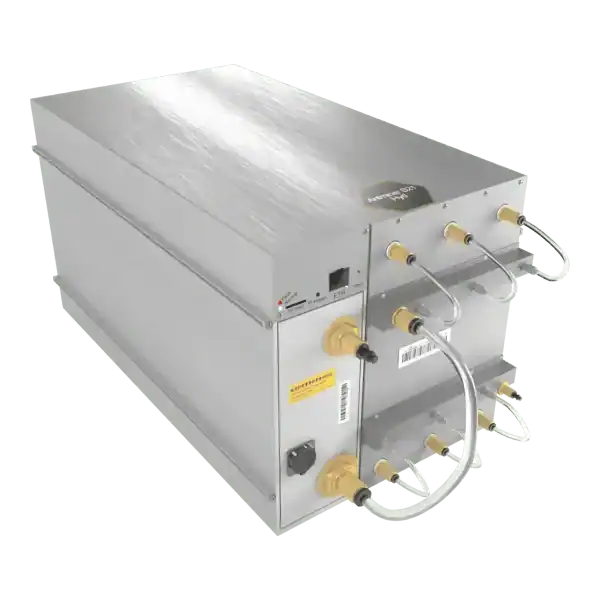






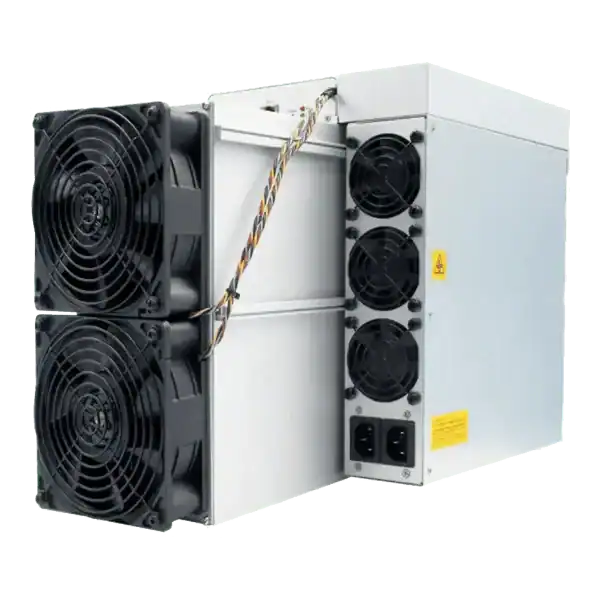
860KSOL
Hashrate
3.3W/KSOL
Efficiency


Antminer Z15 Pro
Equihash · 860KSOL · 2838W · Air Cooled
Gross ROI:8 MonthNet ROI:

Live profit estimates at your electricity price.
| Brand | Mineable Coins | Cooling | Forecasting Notes | % Change | Details | ||||||||||||||||
|---|---|---|---|---|---|---|---|---|---|---|---|---|---|---|---|---|---|---|---|---|---|
| 1 |  Bitmain Bitmain |
Equihash |
   |
860KSOL | 2838W | — | 3.3W/KSOL |  Air Air |
£12,800.00 | £14.88/KSOL | £49.80 | — | £1,515.89 | — | — | 8.4 Months | 142% | ||||
| 6 | Bitmain |
 RandomX RandomX |
       |
1000KH | 2470W | — | 2.47W/KH | Air |
£5,800.00 | £5.80/KH | £36.11 | — | £1,099.06 | — | — | 5.3 Months | 227% | ||||
| 7 | Bitmain |
 SHA-256 SHA-256 |
       |
860TH | 11180W | — | 13W/TH |  Hydro Hydro |
£10,965.00 | £12.75/TH | £31.25 | — | £951.14 | — | — | 11.5 Months | 104% | ||||
| 9 |  BitDeer BitDeer |
SHA-256 |
|
660TH | 8250W | — | 12.5W/TH | Hydro |
£9,730.00 | £14.74/TH | £23.98 | — | £729.94 | — | — | 1.1 Years | 90% | ||||
| 10 | Bitmain |
SHA-256 |
|
580TH | 5510W | — | 9.5W/TH | Hydro |
£10,800.00 | £18.62/TH | £21.07 | — | £641.47 | — | — | 1.4 Years | 71% | ||||
| 22 | BitDeer |
SHA-256 |
|
500TH | 6750W | — | 13.5W/TH | Hydro |
£6,750.00 | £13.50/TH | £18.17 | — | £552.99 | — | — | 1 Year | 98% | ||||
| 25 | Bitmain |
SHA-256 |
|
495TH | 5940W | — | 12W/TH | Hydro |
£6,438.65 | £13.01/TH | £17.99 | — | £547.46 | — | — | 11.8 Months | 102% | ||||
| 27 |  MicroBT MicroBT |
SHA-256 |
|
484TH | 7502W | — | 15.5W/TH | Hydro |
£4,076.00 | £8.42/TH | £17.59 | — | £535.29 | — | — | 7.6 Months | 158% | ||||
| 38 | Bitmain |
 Scrypt Scrypt |
      |
27GH | 5670W | — | 210W/GH | Hydro |
£5,999.00 | £222.19/GH | £14.73 | — | £448.41 | — | — | 1.1 Years | 90% | ||||
| 41 | MicroBT |
SHA-256 |
|
438TH | 6789W | — | 15.5W/TH | Hydro |
£3,416.40 | £7.80/TH | £15.92 | — | £484.42 | — | — | 7.1 Months | 170% |






The table above always shows the current leader. Whichever machine sits first on the earnings view is the answer right now.
Profit is that revenue minus your electricity. Enter your rate and the table does the subtraction for every machine at once.
Set your pence per kWh in the energy cost field and every figure converts to profit at your rate. Hosting customers can pick a hosting site instead and its rate is applied for them.
A machine can earn ten percent more or less within a week without anything changing in your setup. Build that swing into your planning rather than being surprised by it.
Your defence is efficient hardware and knowing each machine's break-even power price before you commit. Machines with headroom above your rate survive the rough patches.
If you are unsure, test the table at two or three rates. Watching the ranking reorder tells you quickly how sensitive each machine is to power costs.
Yearly figures are useful for planning but lean hardest on the assumption that today's conditions hold. Treat them as a scale, never a promise.
Check the hashrate figure on each row or card before comparing prices anywhere else.
An efficient mid-size machine can out-profit the highest earner once electricity is paid, particularly at domestic rates. See the highest earning ASIC miners ranked on raw output alone.
Real results also depend on pool fees, uptime, cooling and firmware. Expect the estimate to be a fair guide, then run the machine well to keep it honest.
Filter the table to your constraints first. The most profitable machine you can actually run well beats the most profitable machine on paper.
At low electricity rates a good used machine is a strong profit play. At domestic rates, newer efficient hardware usually wins over the year.
Select a hosting site in the table to see the effect on your shortlist, then read about our hosting options or ask us for a quote.
If you want a second opinion first, talk to the team. We mine with this hardware ourselves and will compare your shortlist clearly.