
Quickest ROI ASIC Miners in 2026
Quickest ROI ASIC Miners
Estimated payback from current prices and earnings.
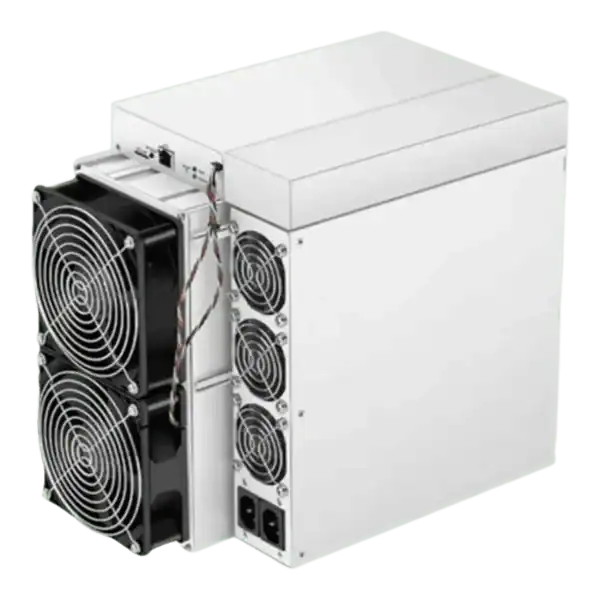
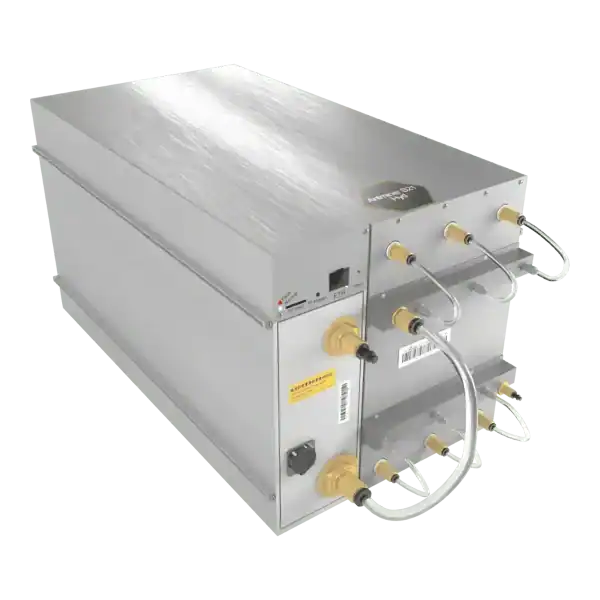
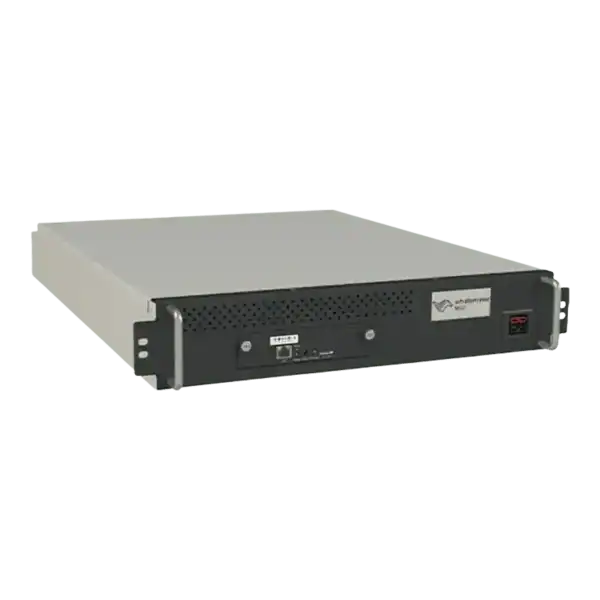
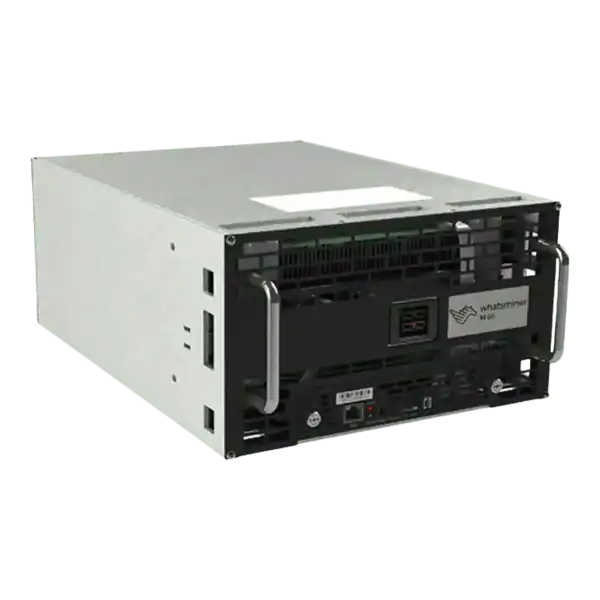
| Brand | Mineable Coins | Cooling | Forecasting Notes | % Change | Details | ||||||||||||||||
|---|---|---|---|---|---|---|---|---|---|---|---|---|---|---|---|---|---|---|---|---|---|
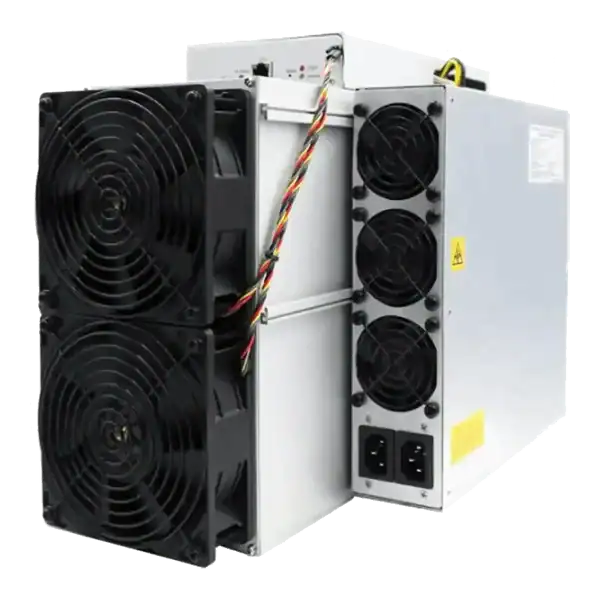
| 7 |  Bitmain Bitmain |
 SHA-256 SHA-256 |
       |
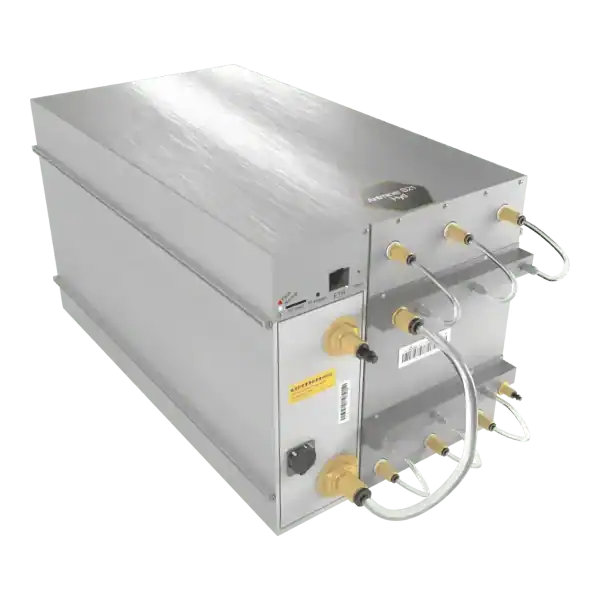
293TH | 5567W | — | 19W/TH |  Hydro Hydro |
£1,470.00 | £5.02/TH | £10.78 | — | £328.22 | — | — | 4.5 Months | 268% | ||||
| 13 | Bitmain |
 RandomX RandomX |
       |
1000KH | 2470W | — | 2.47W/KH |  Air Air |
£5,800.00 | £5.80/KH | £36.13 | — | £1,099.56 | — | — | 5.3 Months | 228% | ||||
| 14 | Bitmain |
SHA-256 |
|
288TH | 4896W | — | 17W/TH | Hydro |
£1,825.00 | £6.34/TH | £10.60 | — | £322.61 | — | — | 5.7 Months | 212% | ||||
| 16 | Bitmain |
SHA-256 |
|
120TH | 2760W | — | 23W/TH | Air |
£800.00 | £6.67/TH | £4.42 | — | £134.42 | — | — | 5.9 Months | 202% | ||||
| 22 | Bitmain |
SHA-256 |
|
319TH | 5104W | — | 16W/TH | Hydro |
£2,233.00 | £7.00/TH | £11.74 | — | £357.34 | — | — | 6.2 Months | 192% | ||||
| 25 |  MicroBT MicroBT |
SHA-256 |
|
336TH | 6686W | — | 19.9W/TH | Hydro |
£2,450.00 | £7.29/TH | £12.37 | — | £376.38 | — | — | 6.5 Months | 184% | ||||
| 27 | MicroBT |
SHA-256 |
|
280TH | 5460W | — | 19.5W/TH |  Immersion Immersion |
£2,072.00 | £7.40/TH | £10.30 | — | £313.65 | — | — | 6.6 Months | 182% | ||||
| 29 | Bitmain |
 X11 X11 |
 |
1770GH | 2839W | — | 1.6W/GH | Air |
£1,700.00 | £0.96/GH | £6.48 | — | £197.28 | — | — | 8.6 Months | 139% | ||||
| 30 | Bitmain |
SHA-256 |
|
395TH | 5925W | — | 15W/TH | Hydro |
£2,970.00 | £7.52/TH | £14.54 | — | £442.47 | — | — | 6.7 Months | 179% | ||||
| 31 | MicroBT |
SHA-256 |
|
272TH | 5412W | — | 19.9W/TH | Immersion |
£2,060.00 | £7.57/TH | £10.01 | — | £304.69 | — | — | 6.8 Months | 177% |
How to Read Payback Times

Read Est. ROI in Days

Apply Your Energy Cost

Weigh Price Against Speed

Stress Test the Estimate
How the ROI Ranking Works

Price Divided by Earnings

Today's Rates Only
Your Power Changes Everything

Coin Price Moves

Difficulty Climbs

Purchase Price

Hardware Generations

Electricity Rates

Most Profitable

Highest Efficiency

Best Value

Best Overall
Top 10 ASIC Miners
Want a realistic payback picture before you buy?
Important!



How Buying Your ASIC Miner Works

Choose Your Miner

Order & Pay Securely

Delivered & Supported


Quickest ROI ASIC Miners: Your Questions Answered
Frequently Asked Questions About ASIC Miner Payback

The staircase below and the table above always show the current order. Whichever machine holds the top row is the answer right now.
Enter your electricity rate and the daily earnings become profit instead of revenue, which lengthens the estimate to something closer to your reality.
Pool fees, uptime, cooling and your real power rate all shape the outcome too. Use ROI to compare machines against each other, never as a promise of when you break even.
It cuts both ways: rallies shorten paybacks. The estimate is a snapshot of a moving picture, which is exactly why it updates live on this page.
Enter your rate and watch the days stretch. Machines whose estimate barely moves are the efficient ones, and that resilience is worth paying attention to.
A price cut on one machine can hand it the top row overnight. That churn is normal and the reason a live ranking beats any written list.
The strongest buys score well on both. A machine near the front of the ROI and efficiency views at your rate is as safe as this market gets.
That is why mid-priced, recent, efficient machines so often hold the quickest ROI spots rather than the very cheapest hardware.
If a purchase only makes sense with resale included, it usually does not make sense.
Shorter horizons simply carry less exposure to difficulty rises and price swings, which is why buyers compete for the front of this table.
Buy machines whose break-even power price sits well above your rate. That headroom is what absorbs difficulty rises without tipping the machine into loss.
Select a hosting site in the table to see the effect on your shortlist, then read about our hosting options for current rates.
Machines bought near the front of the ROI and efficiency views absorb that pressure best. Timing launches perfectly is not possible, so buy the numbers in front of you.
Want the numbers pressure tested first? Talk to the team and we will run your shortlist at your rate before you commit.