

Sealminer A4 Ultra Hydro
Bitcoin & Bitcoin Cash ASIC Miner
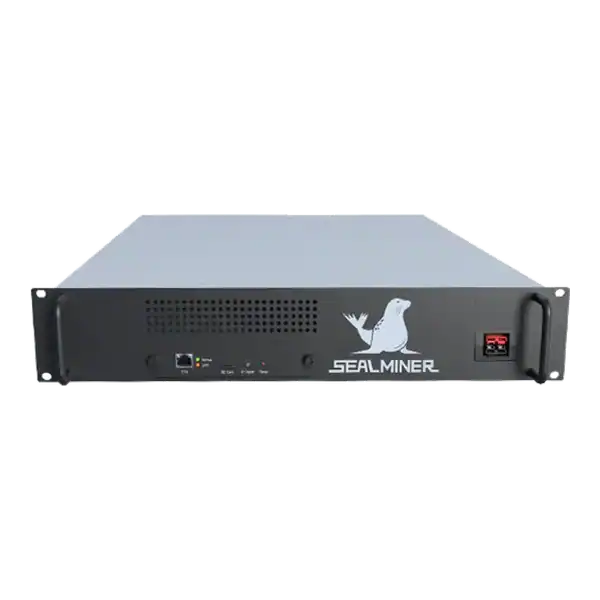

886TH
HASHRATE
9.45W/TH
EFFICIENCY
8373W
POWER
£925.82
EST. MONTHLY
NO PAYBACK
EST. ROI
Use daily ASIC hashrate history with power, temperature, pool and change records to distinguish faults, curtailment, tuning and normal share variation.
Daily ASIC hashrate history becomes useful when it is treated as a time series rather than a row of headline averages. A daily pool estimate can reveal sustained loss. But it cannot by itself identify a failing hashboard, a power interruption, curtailment, tuning, pool variance or a reporting gap.
Diagnosis improves when each worker has a stable identity and the hashrate series is aligned with wall power, board temperature, reject rate, uptime, pool route, firmware and a written change log. This guide shows how to read the shape of the data and preserve enough evidence to act safely.
Daily ASIC hashrate history is a map of when performance changed, not an automatic diagnosis. Stable worker identity, clear time boundaries and a realistic baseline make the map trustworthy.
A mining technician is checking daily ASIC hashrate history. If several miners share a pool worker name, a daily average can show that the group declined but not which machine caused it.
Give every physical miner a stable worker identifier and retain its serial, model, location and firmware. If several miners share a pool worker name, a daily average can show that the group declined but not which machine caused it. If one worker name is reused for a replacement, the chart can hide that the underlying asset changed.
Choose the source deliberately. Pool-side daily hashrate reflects accepted share work for the target. Local management history reflects what the device or agent recorded. Keep both where possible and label the source, unit, time zone and averaging method.
Braiins Pool’s documented daily endpoint supplies a dated twenty-four-hour average and total shares. At the same time, its worker endpoint provides shorter windows. A commercial system may use different boundaries. Save the definition with the export so a future reviewer does not compare calendar-day values with rolling twenty-four-hour values.

Select a stable period after commissioning when the miner had normal power, cooling, network and pool access. Calculate the median or a robust range rather than declaring the single best day to be normal. The baseline should reflect the operating mode you actually intend to keep.
Separate planned operating profiles. An underclocked weekend tariff, summer heat limit or demand-response event should not be judged against full-power winter output. Store mode and expected power beside the hashrate record.
Use delivered performance rather than only nameplate hashrate. Manufacturing tolerance, ambient conditions and firmware profiles mean two nominally identical miners may have different stable baselines. An alert can compare each worker with its own history and also flag outliers against its peer group.
A sudden step down that remains flat often points to a board loss, a deliberate mode change or a power limit. A gradual decline can reflect rising temperatures, accumulating hardware errors, cooling degradation or a tuning change. A repeating time-of-day pattern may follow tariffs, ambient temperature, curtailment or a scheduled network event.
A drop to zero with a clean return suggests power, connectivity, restart or pool-routing interruption. Frequent short gaps can disappear inside a daily average. So drill into the higher-resolution interval around the event. Conversely, one low daily point can be a data-collection failure rather than a full day of lost production.
Pool hashrate alone can wander through normal share variance. If local output and wall power remain stable, rejects are normal and the longer pool window recovers, avoid an unnecessary reboot or retune. Look for repeated evidence across sources before changing a working machine.
| Chart shape | Possible causes | Evidence to align |
|---|---|---|
| Persistent step down | Board loss, mode or limit | Board count, power and change log |
| Gradual decline | Heat, errors or cooling | Temperature, fan or flow and error rate |
| Daily repeating dip | Tariff, ambient heat or curtailment | Site schedule and weather or inlet data |
| Zero then recovery | Power, network or restart | Uptime, PDU and event logs |
| Pool-only volatility | Share variance or route | Local rate, rejects and longer pool window |
Wall power distinguishes lost work from deliberate efficiency tuning. If hashrate and power fall together after an approved profile change, the miner may be operating exactly as intended. If power stays near normal while hashrate falls, investigate board, chip, firmware and cooling behaviour.
Temperature needs context. Compare inlet, outlet and board readings with fan speed or liquid flow and ambient conditions. A daily maximum alone can hide repeated thermal throttling. At the same time, an average can hide one board running materially hotter than the others.
For hydro and immersion systems, include pump, flow, coolant inlet and heat-rejection events where available. A miner history that omits the supporting plant can misclassify a site cooling problem as repeated hardware failure.
Annotate firmware updates, configuration changes, pool moves, maintenance, cleaning, board swaps, network work and power events. Record who approved the change and which workers were affected. A chart without change history often shows exactly when a problem began but not what changed.
Deploy changes to a controlled group and compare it with an unchanged group under similar conditions. This helps separate a firmware or tuning effect from a site-wide temperature or network event. Keep the original package and configuration needed for rollback.
Where an automated tool changes performance dynamically, export the requested setpoint as well as the observed hashrate. Otherwise the history can make authorised control look like instability.
Create alerts for sustained deviation, not every noisy interval. A daily process can flag workers below their own baseline, missing data, elevated rejects, power without expected hashrate and recurring restarts. The threshold should reflect the fleet’s measured variability.
Before opening a repair case, package the worker identity, date range, local and pool charts, board telemetry, power, temperatures, logs and recent changes. This shortens diagnosis and reduces the chance that a machine is returned with an intermittent site fault unresolved.
Use the history to measure whether a fix worked. Compare like-for-like periods after the repair and note any change in profile or environment. Close the incident only when the accepted hashrate, power and stability return to an agreed range.
Daily ASIC hashrate history is a map of when performance changed, not an automatic diagnosis.
Give every physical miner a stable worker identifier and retain its serial, model, location and firmware.
Select a stable period after commissioning when the miner had normal power, cooling, network and pool access.
A sudden step down that remains flat often points to a board loss, a deliberate mode change or a power limit.
Daily ASIC hashrate history is a map of when performance changed, not an automatic diagnosis. Stable worker identity, clear time boundaries and a realistic baseline make the map trustworthy. Power, cooling, rejects, uptime and change records then explain its shape.
This process is intentionally distinct from reconciling a current local and pool reading: it focuses on trend, recurrence and proof that an intervention restored sustained performance.
Set a worker-level baseline and keep a dated change log before the next firmware or site change, then use the troubleshooting guide when a sustained deviation appears.
Use daily history to find persistent changes and recurring patterns, not to explain every short dip. Align hashrate with power, temperature, rejects, uptime and configuration events before naming a cause.
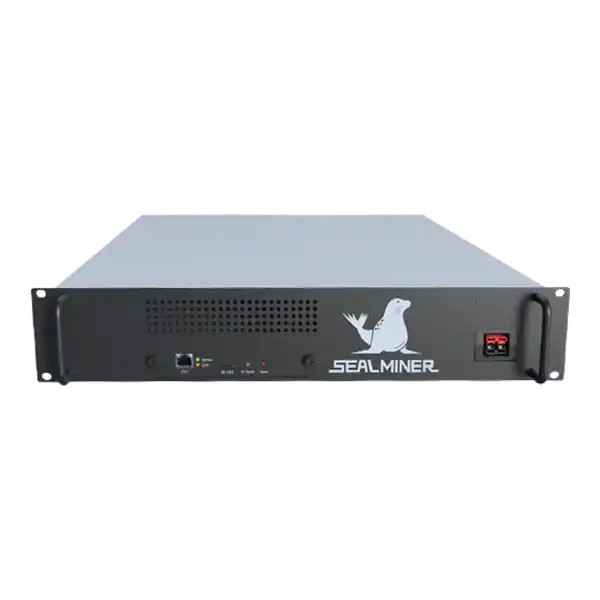

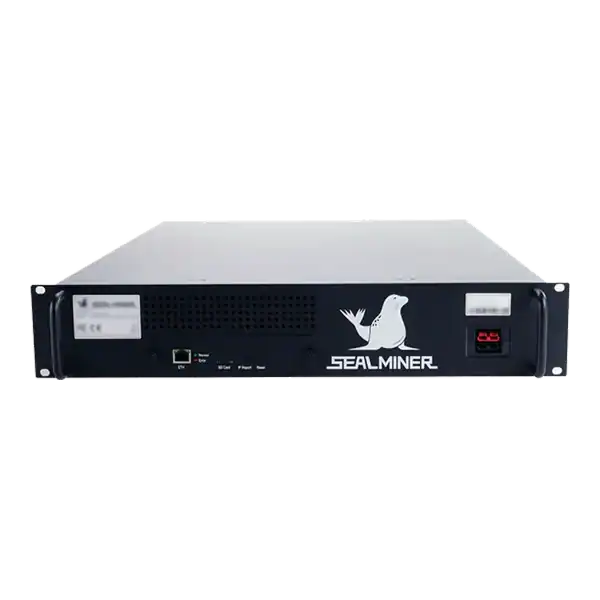

Prepare an ASIC repair evidence pack with serial, condition, firmware, board status, logs, wall power, accepted work, photographs and safe fault history.

ASIC repair partner: Confirm capability for the exact miner, power supply, control board and hashboard rather than accepting a general claim to repair ASICs.
Understand ASIC Miner Troubleshooting. Use safe diagnostics, protect warranty cover and make informed repair decisions before choosing equipment.
Join the ASIC Mining Discussion
Members can read and join the discussion
Log in to read comments from other miners. Create a free account if you would like to ask a question or share your experience.
Membership helps us protect the discussion from spam and keep answers useful.